
The Vanishing Act
A food-waste refiner in the Greater Toronto Area was losing thousands of litres of used cooking oil each month. Collection drivers would pull up to restaurant bins expecting full tanks, only to find them mysteriously drained dry. The losses weren’t just an inconvenience; they were beginning to threaten the company’s bottom line.
For investigators, this is familiar territory in an unexpected way. Ours is a profession so broad, so varied, that no one can claim to know every corner of it. One day you’re unravelling a workplace harassment complaint; the next you’re dropped into the shadow economy of used cooking oil, trying to understand a commodity most people don’t even realize has value. That’s the nature of the work: you enter industries you’ve never set foot in, learn their pressures and vulnerabilities at speed, and figure out how the crimes are being committed before the losses get worse. In this case, we had to understand the entire supply chain—how oil was collected, who refined it, how it was priced, black-market buyers and where it ultimately went. Without that context, the losses would never make sense.
What Cooking Oil Actually Is
In the restaurant industry, cooking oil is a working material, not just an ingredient. Most commercial kitchens rely on high-volume vegetable oils—canola, soybean, sunflower, or blended frying oils—chosen for their high smoke points, neutral flavour, and thermal stability. These oils fill deep fryers used continuously throughout the day for items such as chips, chicken, fish, and other fast-service foods. The oil is heated to temperatures typically between 170°C and 190°C and reused repeatedly until it degrades through oxidation, moisture exposure, and food particle contamination.
By the time it is ready to be discarded, it is no longer the clear, golden liquid poured from a fresh container. It is “dirty oil”—darkened, viscous, and saturated with suspended crumbs, batter fragments, carbonized residue, salt, proteins, and microscopic food particles left behind from repeated frying cycles. Each basket lowered into the fryer sheds organic material into the oil. Moisture from frozen products accelerates breakdown. Fine sediment accumulates at the bottom of the vat. Even with daily skimming and filtration, the oil gradually becomes chemically unstable and physically contaminated. Its smoke point drops. It begins to foam. Flavours transfer from one product to another. What once provided clean, efficient heat becomes degraded and inconsistent.
At that stage, it must be replaced—not because it is useless, but because it no longer meets food-service standards. For high-output restaurants, this turnover happens frequently. What remains is not a small amount scraped from a pan, but dozens—sometimes hundreds—of litres of dark, particulate-laden waste oil pumped into sealed exterior storage tanks awaiting collection. Though it appears spent and unsightly, this “dirty oil” still contains recoverable energy value. It can be filtered, dewatered, processed, and refined into usable feedstock. It is at this point—once it leaves the fryer and sits behind the building, thick with residue and food remnants—that the oil quietly shifts from kitchen necessity to tradable commodity.
The Hidden Industry Behind Used Cooking Oil (UCO)
Most people assume used cooking oil is waste, something destined for the bin once it cools in a fryer. But scratch the surface and you uncover an entire industry built around collecting, transporting, and refining what many still see as nothing more than kitchen residue. Across Canada and the United States, licensed collectors haul thousands of litres each day to processing facilities where the oil is filtered, cleaned, and refined into a market-ready product known as “yellow grease.”
From there, it flows into a global supply chain that feeds renewable diesel producers, biodiesel manufacturers, industrial lubricant makers, cosmetic suppliers, and even certain agricultural feed operations. What was once a smelly by-product behind a restaurant has become a renewable, in-demand commodity; propped up by carbon-reduction targets, sustainability mandates, and the growing need for low-carbon fuel alternatives. Quietly, and largely out of public view, this overlooked substance has become a multi-billion-dollar component of the circular economy.
In Canada, used cooking oil has become a defined segment of the renewable economy. The market was valued at approximately $331 million USD in 2024 with projections nearing $458 million USD by 2030 as biodiesel demand grows. In 2023, more than 253 million litres of used oil were collected nationally, with recovery rates exceeding 80 per cent. What leaves the fryer as waste now circulates as a measurable revenue stream within Canada’s low-carbon fuel supply chain.
In the United States, scale drives both value and volume. An estimated 850 million gallons (over 3.2 billion litres) of used cooking oil were recovered in 2022. The broader North American market is valued in the $2 to 3 billion USD annually and continues to expand alongside renewable diesel production. Discarded fryer oil has evolved into a strategic industrial feedstock directly linked to federal and state energy policy.
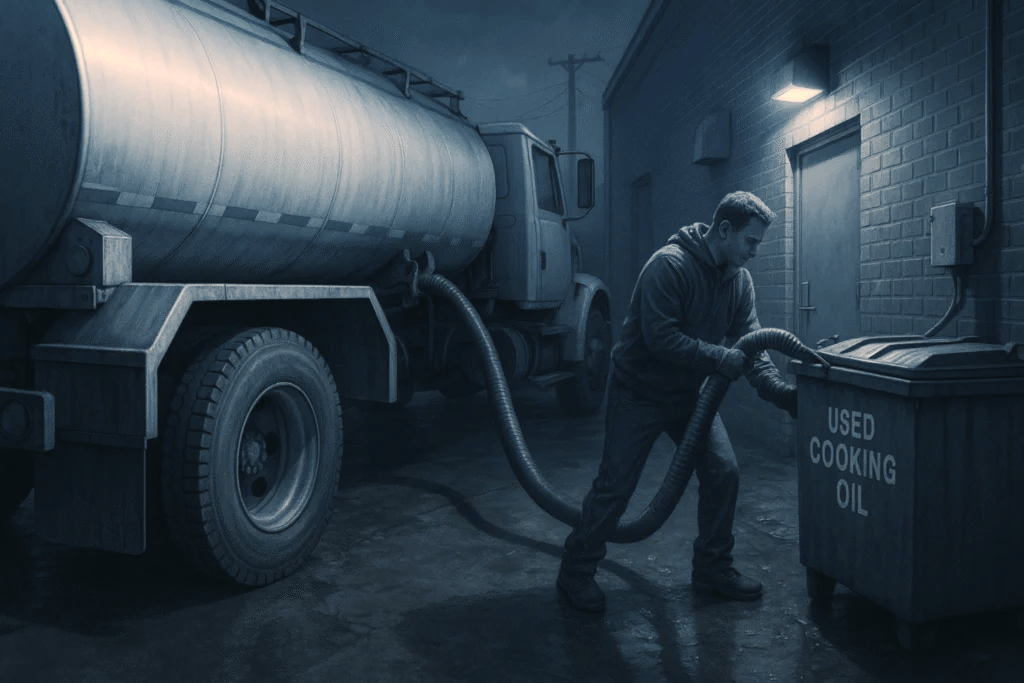
And that hidden value is exactly why theft has surged. A single collection drum sitting behind a restaurant might look worthless, but to organized crews who understand the market, it’s a container full of money. When properly refined, used cooking oil can be sold to legitimate processors at prices that rival certain petroleum feedstocks. Industry insiders estimate that millions of dollars are siphoned off each year before licensed collectors ever arrive, with thieves pumping tanks in minutes and disappearing into the night.
Legitimate used cooking oil collectors operate under formal service contracts with restaurants, granting them the exclusive right to retrieve and process oil from designated locations. Once the oil is transferred from the fryer into the exterior storage bin, it typically ceases to be the restaurant’s commodity and becomes the collector’s asset under the terms of that agreement. Drivers then service assigned routes on scheduled days—much like the courier or small-parcel industry—where territory, timing, and efficiency are tightly managed. Each pickup forms part of a coordinated network designed to secure supply and protect revenue.
Because many restaurant owners view the oil as waste rather than property, unauthorised collection often goes unnoticed or unreported. Yet when a tank is siphoned, the loss is borne by the contracted collector, not the restaurant. What appears to be a minor after-hours activity behind a building is, in practical terms, the removal of an asset tied directly to an established commercial agreement and a predictable revenue stream.
The real impact is far greater than a stolen drum: every litre taken undermines a legitimate, regulated industry built on environmental compliance, renewable-fuel production, and sustainable waste management. Once you follow the supply chain end to end, the story becomes clear: used cooking oil isn’t garbage—it’s a renewable resource with real economic weight. And used cooking oil theft isn’t petty crime; it’s the systematic extraction of a valuable commodity from an industry most people don’t even know exists.
The Initial Ask
One of the most significant inflection points in this investigation arose from the client’s firm belief that a specific competitor was responsible, albeit with no articulatable reason. From their perspective, the conclusion felt obvious: overlapping territories, similar equipment, and industry rivalry created a convincing narrative. However, opinion is not evidence. In investigations, tunnel vision or confirmation bias can quietly shape strategy, drawing time, resources, and attention toward a theory that feels right rather than one that is supported by data. There is often emotional pressure when a client has already formed a conclusion, particularly when financial losses are mounting and trust in competitors is low. Yet investigative discipline requires that hypotheses be tested, not defended.
To prove or disprove that theory, our team coordinated surveillance on that competitor. Surveillance in this matter was not straightforward. The activity occurred at night, when traffic was sparse and unfamiliar vehicles were more conspicuous. The collection points were located behind restaurants in industrial and commercial plazas—areas with limited lighting, restricted sightlines, and few legitimate reasons for lingering. Our objective was precise: identify who was siphoning the cooking oil, document the exact locations involved, and obtain clear, admissible video evidence of the activity.
After several nights without incident, it was clear they were not involved and we needed a new approach.
Applying Data Analysis
The client had also provided us with a record of roughly 2,000 theft incidents—each noting date, time, and location—without realising they were sitting on a treasure trove of data. Buried inside those lines of losses was the solution to the entire case. We just needed to figure out how to extract it.
The analytical phase began with preparing the data so it could withstand scrutiny and provide a structured interrogable database. The client’s incident log, while comprehensive, required cleaning before meaningful conclusions could be drawn. Duplicate entries were removed, incomplete records were reconciled, and inconsistent timestamp formats were standardized to allow accurate temporal comparison. Where only partial time data existed, entries were normalised to the closest verifiable window to preserve integrity without introducing distortion.
By charting these events over calendar weeks, a consistent pattern emerged: most losses occurred in the early hours of Tuesday and Thursday mornings. This suggested that the competitor had done its own recognizance to know when to arrive at restaurants outside of the restaurant’s operating hours, when the bins would be most full and when to arrive so as to avoid the contracted collector’s arrival. Using that pattern, we scheduled targeted monitoring for the next predicted window rather than maintaining round-the-clock surveillance.
Geographic Clues
A spreadsheet can only tell half the story, so we next converted each incident address into map coordinates, enabling precise spatial plotting rather than relying on descriptive locations. Once structured, the dataset was subjected to frequency distribution analysis to determine recurrence by day of week, hour block, and location density. Equally important was analyzing absence data: locations with comparable exposure and volume that reported no thefts at all. In pattern analysis, what does not occur can be more revealing than what does.
Toronto is unique in that the major routes are located on a grid with streets run east/west and north/south. Placing the theft locations on the map was akin to coordinates of a scatter plot. One after another, the dots emerged like impact points on a ballistic chart, clustering in a way that suddenly made the city’s restaurant layout and the thieves’ chosen routes impossible to ignore. Surveillance became easier to strategize knowing where and when the thieves were most likely to target. Visualizing the locations, also helped identified the voids on the map, defining the boundaries of the offenders’ operating comfort zone and how far they would be comfortable travelling within their defined time window, truck capacity and cost effectiveness. Almost instantly, a geographic “bald spot” emerged: a tightly grouped swath of restaurants that had never reported a single theft. This anomaly begged the question: why would the thieves avoid this area?
Using OSINT, we the identified and overlaid every known cooking-oil operation—competitors included—onto the same map. One operation sat squarely in the bull’s-eye of that untouched zone, suggesting its crews deliberately avoided this area to maintain distance, operate unchecked, and reduce the risk of detection. Yet that calculated avoidance became the most telling indicator of all. The absence of thefts in a dense commercial area was statistically abnormal, and when viewed against the location of that collector, while most likely unintentional, the omission was no longer incidental. It was strategic. By attempting to insulate their resale point from their theft activity, the operators unintentionally created a geographic signature. What they believed would shield them instead narrowed the field. The very space they refused to touch became the analytical pivot that directed the investigation straight to their doorstep.
Focused Surveillance and Resolution
On the evening identified through predictive analysis, surveillance units were deployed within the corridor previously isolated through temporal and geographic modelling. Observation positions were established in advance of the forecasted activity window. The objective was to document vehicle movements originating from the competitor’s depot and determine whether those movements corresponded with theft locations associated with our client’s contracted accounts.
During the early morning hours, trucks departed the competitor’s yard and proceeded directly to restaurant locations known to be under exclusive contract with our client. At multiple stops, individuals were observed accessing exterior storage tanks and transferring used cooking oil into their vehicles using pumping equipment. The activity was consistent, methodical, and completed within short intervals. After servicing multiple locations, the trucks returned to their originating facility.
All movements were captured on video. Vehicle identifiers, routes, times, and collection activity were documented in sequence. The recorded evidence established a clear link between the departing vehicles, the unauthorized collections, and the return to the competitor’s base of operations. The material was subsequently provided to authorities and formed the evidentiary foundation for criminal charges.
Key Outcomes
Surveillance initially directed at the suspected competitor identified by the client ultimately produced no supporting evidence; however, that outcome was not a setback; it was progress. Disproving a theory narrows the field, preserves objectivity, and prevents the far greater cost of pursuing the wrong target indefinitely. In this case, releasing the initial assumption was what allowed the data to guide us toward the correct conclusion.
That turning point demonstrates how disciplined, structured data analysis can fundamentally alter the trajectory of an inquiry. Rather than relying on assumption, prolonged surveillance, or broad operational sweeps, we treated the client’s historical loss records as evidentiary data. By reorganising nearly 2,000 reported incidents into temporal and geographic frameworks, we were able to identify repeatable patterns, predict likely theft windows, and narrow the operational focus to one specific collector. That analytical pivot transformed what had been an open-ended loss problem into a targeted enforcement operation.
Had analytics not been utilised in this case, the underlying cause of the losses may never have been identified, and the client could have continued to absorb incremental, recurring thefts—slowly bleeding profit margins to the point where the sustainability of the business itself was at risk.
By isolating the most probable times and locations for theft, we reduced surveillance hours by more than 70 per cent compared to traditional blanket coverage. The responsible party was identified during a single, focused deployment, and the evidence obtained supported criminal charges. Beyond the immediate enforcement outcome, the client realised measurable cost savings, regained control over their collection routes, and restored confidence in the integrity of their operations.
Conclusion
Analytics should not be viewed as a fallback technique; it is a core component of modern investigative work. From the outset of any inquiry, structured data review can clarify scope, expose patterns, and guide strategic decisions. Visualisations convert raw information into timelines, heat maps, and network diagrams that reveal clusters, anomalies, and relationships that are difficult to detect in narrative reports alone. Trend analysis highlights repetition across days, weeks, or operational cycles. Benchmarking compares performance across locations, routes, departments, or time periods to identify outliers. Predictive modelling builds on these foundations, using historical behaviour to forecast where attention should be directed next. This approach extends well beyond loss prevention. An activity timeline developed from a social media account can clarify movements, associations, and behavioural shifts. A structured lifestyle analysis may reveal financial pressures, evolving interests, or risk indicators. Mapping the network of a subject’s friends, family, and associates can expose influence patterns or undisclosed relationships. Each layer adds context. Each perspective increases clarity. When integrated early, analytics does not replace traditional investigative techniques. Instead, it strengthens them, often revealing critical details that might otherwise be overlooked.
Published in “Case Book, Vol. III” by the Council of International Investigators under the name “Into the World of Liquid Gold: A Case Study in Predictive Intelligence”